
Description
📊 Monthly Budget Analysis Template – Personal Finance Tracker 2025
Stop guessing where your money goes. Thisfully automated Excel workbook gives you a complete, professional-grade personal finance dashboard. Whether you’re saving for a goal, paying down debt, or simply want to understand your spending habits — this template does the heavy lifting for you.
Built with303+ formulas, cross-sheet links, and dynamic charts, it transforms raw monthly numbers into actionable insights. Update your actual income or expenses in one place, and every summary, variance, and chart updates instantly.
🧾 What’s Inside (4 Integrated Sheets)
| Sheet | What It Does |
|---|---|
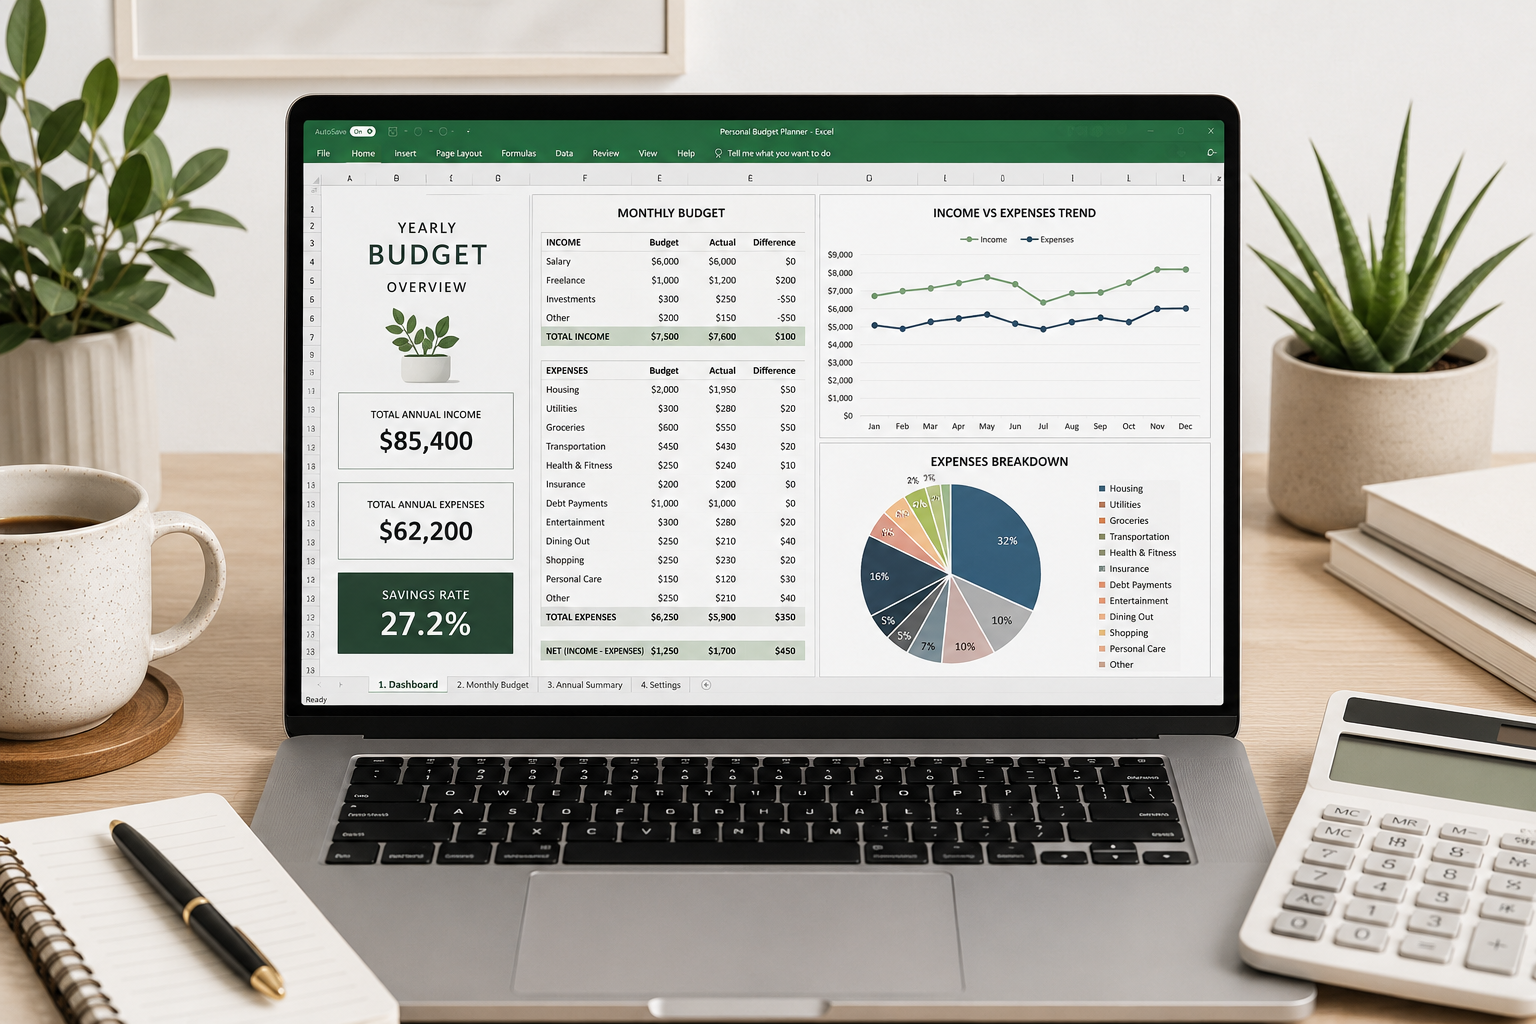
| Cover | Executive summary with key metrics: Total Income, Total Expenses, Net Savings, and Savings Rate (27.2% in the example). Also includes a sheet index for easy navigation. |
| Monthly Budget | Full 12‑month tracker with4 income categories (Salary, Freelance, Investments, Other Income) and13 expense categories (Housing, Groceries, Transportation, etc.). Columns for each month + annual totals, budget targets, variance ($), and variance (%). Everything is formula-driven. |
| Annual Summary | KPI dashboard + monthly income vs. expense trend table + expense breakdown by category. Includes aline chart (income/expense trends) and apie chart (expense composition). |
| Category Analysis | Side‑by‑side budget vs. actual comparison for all 17 categories. Calculates variance ($ and %) and showsstatus indicators (“On Budget” / “Over Budget” / “On Track”). Includes aclustered bar chart for visual variance analysis. |
⚙️ Key Features & Automation
-
303+ Formulas – Everything is calculated automatically. Change any monthly actual and all summaries, KPIs, and charts update in real time.
-
Cross‑Sheet References – Annual Summary and Category Analysis pull directly from Monthly Budget. No manual copy-pasting.
-
Net Income Calculation – Automatically calculated as Income minus Expenses, with conditional formatting for quick insight.
-
Smart Variance Logic – For expenses: positive variance = favorable (under budget). For income: positive = above target.
-
Data Bars – Visual bars on the Annual Total column for instant comparison across categories.
📈 Visualizations Included
-
Line Chart – Monthly Income vs. Expenses (spot seasonal trends)
-
Pie Chart – Expense breakdown by category (see your biggest spending areas)
-
Clustered Bar Chart – Budget vs. Actual side by side (identify overspending fast)
✅ Who Is This For?
-
Individuals & families who want a simple but powerful budget tracker
-
Freelancers with variable monthly income
-
Finance enthusiasts who love Excel but don’t want to build formulas from scratch
-
Small business owners tracking personal finances separate from business books
-
Students learning budgeting and variance analysis
📁 Requirements
-
Microsoft Excel (2016 or later recommended) – Works with Excel for Windows, Mac, and Excel Online (some chart interactions may vary online)
-
No macros required – just formulas and standard Excel features
🔧 How It Works
-
Download the
.xlsxfile -
Open in Excel
-
Go to theMonthly Budget sheet
-
Replace the example numbers with your own monthly income & expenses
-
Watch theCover,Annual Summary, andCategory Analysis sheets update automatically
-
Use the charts to visualize your financial year at a glance
📌The template comes filled with realistic example data. Clear it or overwrite it — your choice.
🛒 What You Get
-
1 x Excel workbook (
.xlsx) – 4 sheets, fully formula-driven -
Ready to use immediately – no setup or installation required
Take the guesswork out of your finances. Buy the Monthly Budget Analysis Template today and see your full financial picture — instantly.
Reviews
There are no reviews yet.